US County Emissions Dashboard
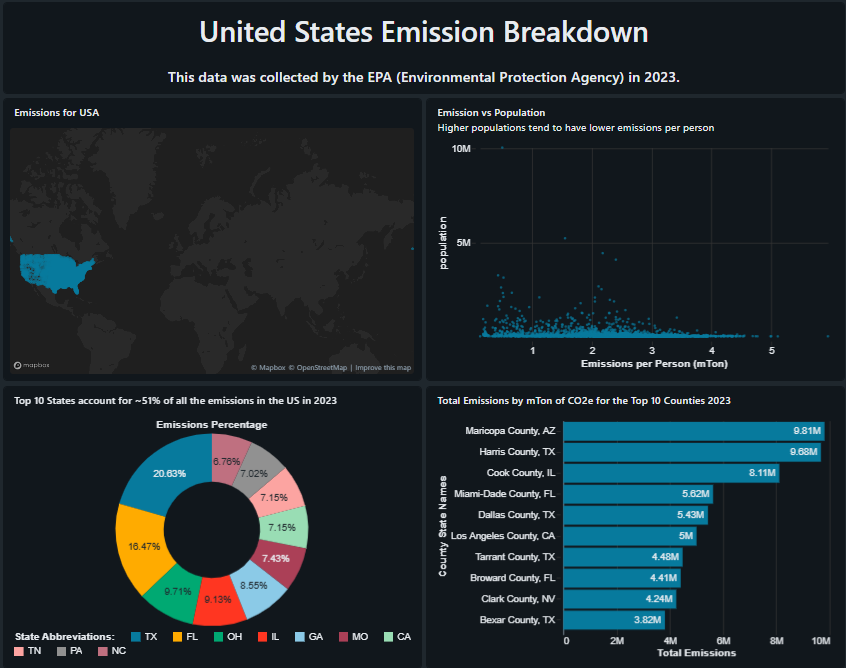
EPA 2023 county emissions in Databricks SQL — US map, emissions vs population, top-10 states (~51% of US total), and top-10 counties (Maricopa, Harris, Cook, …)
- Role
- Data analyst
- Stack
- Databricks SQLLakeviewSQLEPA emissions dataData visualization
Context
Hands-on SQL and visualization on EPA 2023 US county emissions (Emissions_Data_2023.csv). The deliverable is a four-panel Lakeview dashboard: geographic emissions, emissions-per-person vs population, concentration of emissions in the top ten states, and ranked counties by total metric tons CO₂e.
Approach
- Ingest — Load the CSV into Databricks (table or file-backed query) and inspect grain: one row per county with population, employment, and multi-sector energy use.
- SQL — Create result sets for total GHG (
GHG emissions mtons CO2e), geographic labels (county_state_name,state_abbr), and any supporting per-capita or sector cuts used on the board. - Dashboard — Wire Lakeview tiles to those queries, add filters (state, county, year cohort), and publish a shared link for reviewers.
Live demo
Open the published dashboard from the project header. If Databricks prompts for login, use the screenshots in the gallery on this page.
What this demonstrates
Analyst-grade SQL + BI: translating a messy public-style extract into labeled metrics, checking aggregations at county grain, and delivering a dashboard—not only ad hoc notebook cells.
Highlights
- Four-tile Lakeview board: county map, emissions-per-capita vs population scatter, state share donut, top-10 county bar chart
- Top counties by total CO₂e (mTon): Maricopa AZ (~9.8M), Harris TX (~9.7M), Cook IL (~8.1M)
- Top-10 states account for ~51% of US emissions; Texas ~21% and Florida ~16% of that top-10 mix
- Published dashboard + public GitHub repo with SQL exports and static captures
Challenges
Outcomes
- End-to-end SQL + BI deliverable on EPA-style 2023 county emissions data
- Published Lakeview dashboard and public GitHub repository
- Portfolio-ready screenshots documenting map, scatter, state mix, and county rankings