Weather Trend Forecasting
PM Accelerator advanced DS assessment — panel EDA, day-ahead Kyiv forecasts, anomalies, and geo aggregates on 167k+ weather rows
- Role
- Data scientist
- Stack
- PythonpandasJupyterscikit-learnRidge regressionKaggle Global Weather Repository
Context
This was the PM Accelerator advanced data scientist technical assessment: forecast weather trends on the Global Weather Repository Kaggle dataset, with cleaning, EDA, multiple models, ensemble, anomalies, feature importance, environmental and geographical analysis, plus a short demo video and public repo.
Problem
The dataset is a panel of scrape snapshots—268 cities, 41 columns, 167k+ rows—not a single tidy time series. The brief requires using last_updated as the time index and delivering advanced analyses beyond a single chart.
Approach
- Notebook 01 — Parse datetimes, drop one duplicate
(location_name, last_updated), global IQR/QA documentation, Kyiv EDA (temperature + precipitation at observation time). - Notebook 02 — Kyiv
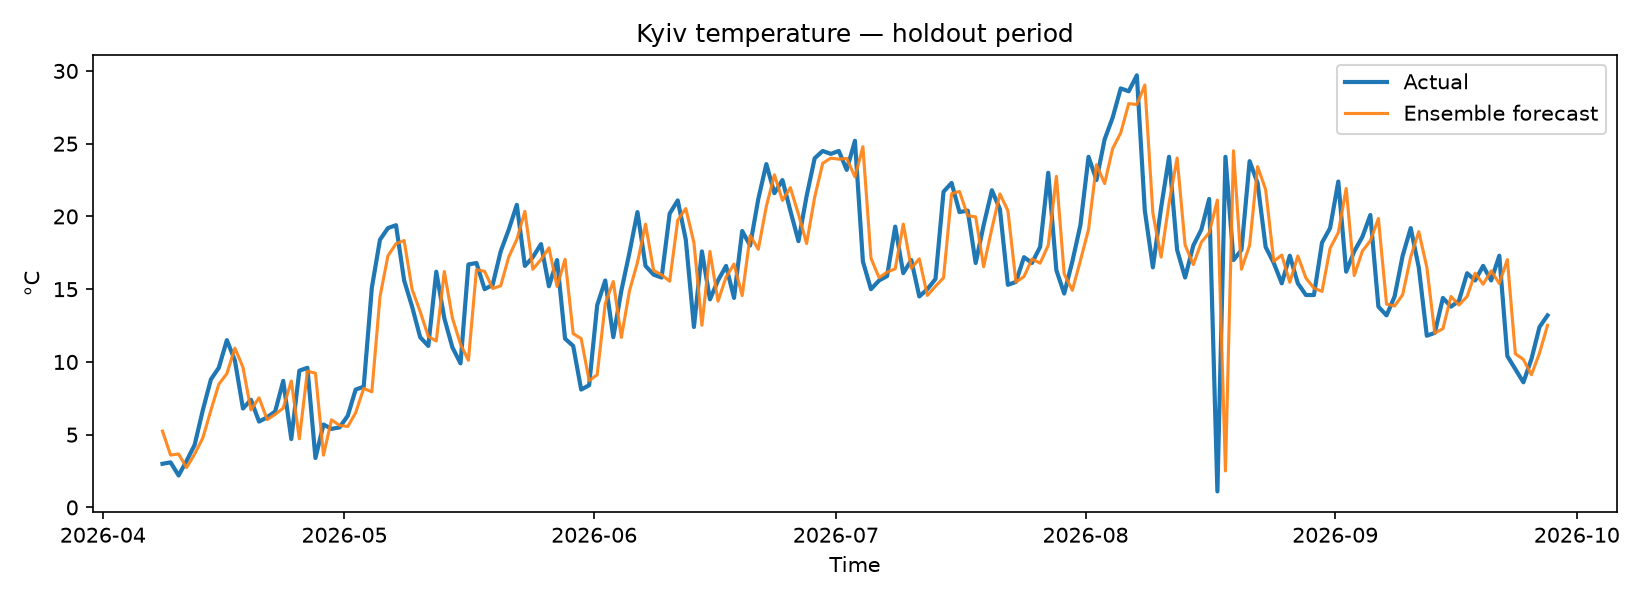
temperature_celsius, 80/20 chronological split, naive / seasonal-365 / Ridge lags[1,2,3,7,14,28], ensemble of Ridge + naive; report lag-span diagnostic for seasonal naive. - Notebook 03 — Robust-z and Isolation Forest anomalies, Ridge lag coefficients, Kyiv weather–air-quality correlations, country mean temperatures with sparse-country filter.
Results (holdout)
| Model | MAE (°C) | RMSE (°C) |
|---|---|---|
| Naive | 2.509 | 3.753 |
| Seasonal naive (365 rows) | 5.993 | 7.528 |
| Ridge | 2.474 | 3.599 |
| Ensemble (Ridge + naive) | 2.474 | 3.653 |
Ridge is the best single model on RMSE; the ensemble ties MAE. The interesting negative result is seasonal naive—documented with observation-hour drift and weather variability, not a false calendar-alignment story.
Artifacts
- GitHub repository — notebooks,
requirements.txt, report PDF, slides, figures - Written report — methodology, caveats, limitations
- Demo video — 2-minute slide walkthrough on YouTube
What this demonstrates
End-to-end data science communication: honest baselines, time-respecting evaluation, advanced methods with interpreted failures, and reproducible artifacts suitable for reviewer scrutiny—not a notebook that only reports the best number.
Highlights
- 167,812 rows × 41 features across 268 cities after key dedupe; Kyiv series (863 obs) indexed by `last_updated`
- Time-ordered 80/20 holdout: Ridge MAE 2.474°C / RMSE 3.599°C — best single model; ensemble ties MAE with naive persistence close behind
- Seasonal naive ~6°C MAE documented honestly: weather variability + observation-hour drift, not calendar misalignment
- Advanced track: 9 robust-z anomalies, Isolation Forest (top 2%), lag importance, Kyiv air-quality correlations, country means with ≥100-row filter
- Reproducible notebooks 01→03, written report, slides, and a 2-minute demo video on YouTube
Challenges
Outcomes
- Public GitHub repo with notebooks, figures, PDF report, and slide deck—CSV kept local per Kaggle terms
- Holdout story defensible under review: Ridge ≈ persistence, seasonal naive as negative result, ensemble as advanced requirement
- Portfolio-grade documentation: executive report, slide deck, and 2-minute walkthrough video